Data analyses and infographics
As part of the Data Centre, statistical analyses of the available datasets are periodically untertaken and published in academic or other media. The presentation as infographics has proven to be a vivid medium in order to make new findings on socially relevant issues accessible for a wider public.
The infographics mostly emerge as a cooperation between different project teams or departments of the University of Vienna. So far, infographics on the topics of migration, value change and labour market have been published. These infographisc utilise secondary data e.g. from Statistics Austria (microcensus) and Eurostat (EU-SILC data), or use datasets that were generated through research projects at the department, like the Austrian Study on Value Formation (ÖWBS) and the Vienna Quality of Life Studies.
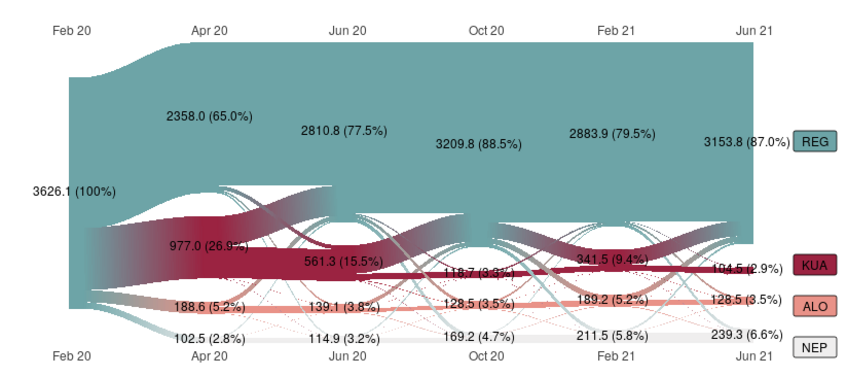
Labour Flows Covid-19
Continue to this infographics...
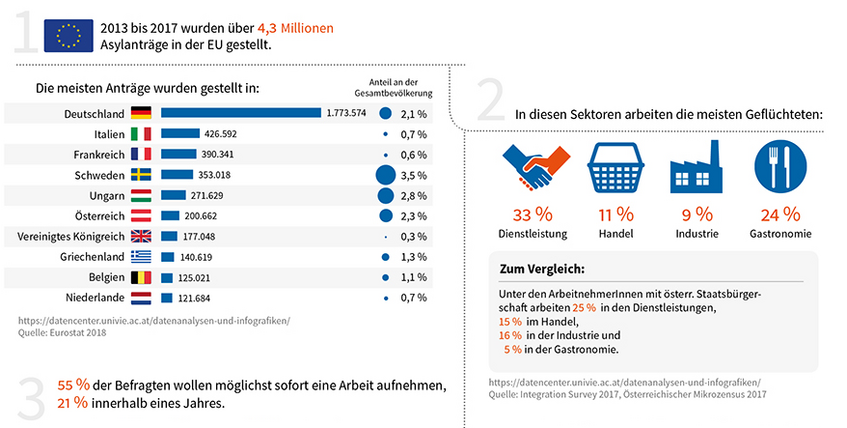
Refugees in the labour market
Continue to this infographics...

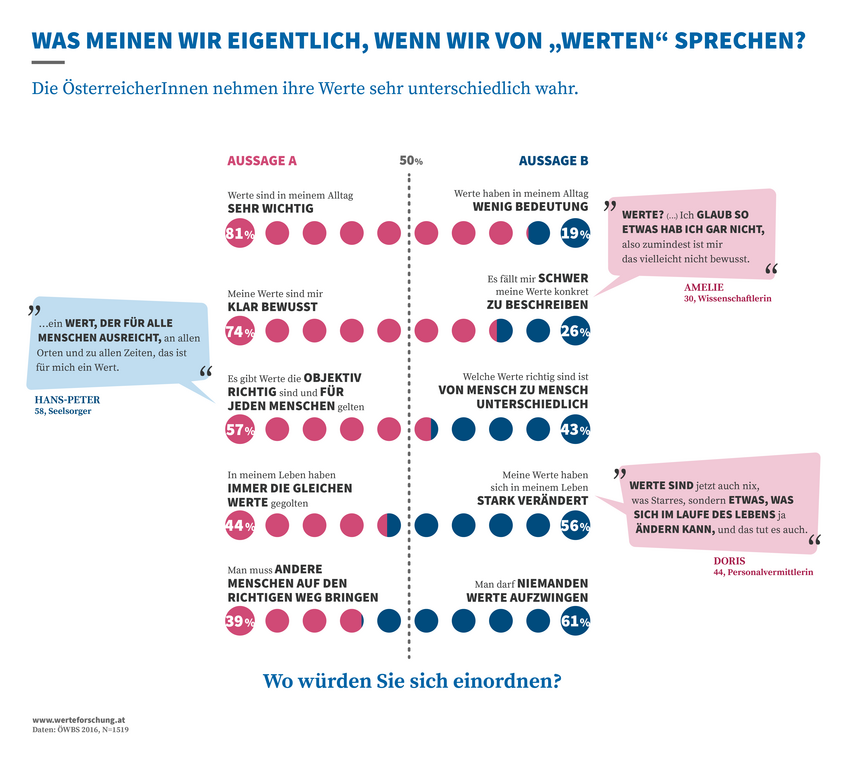
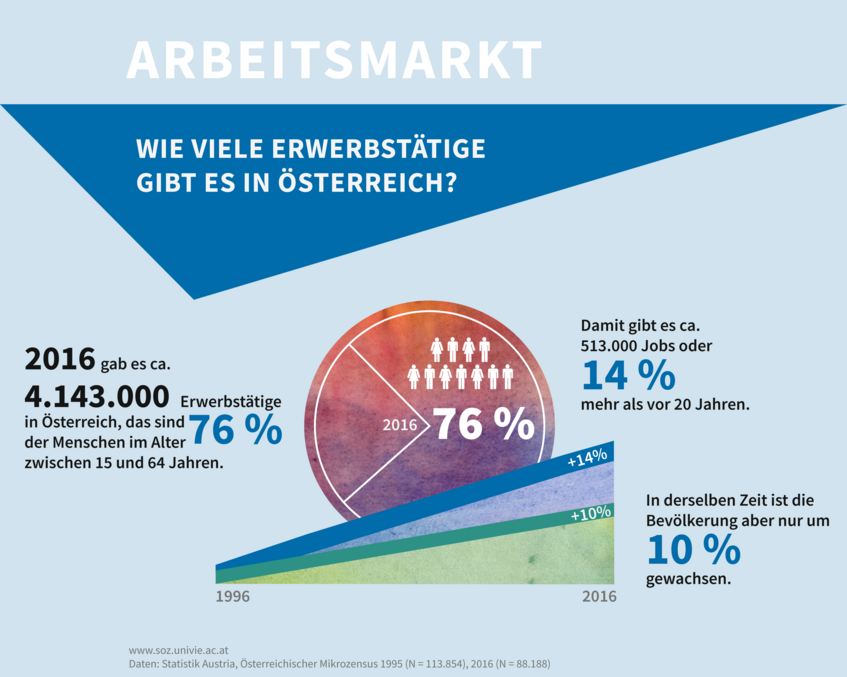
Labour market
Continue to this infographics...
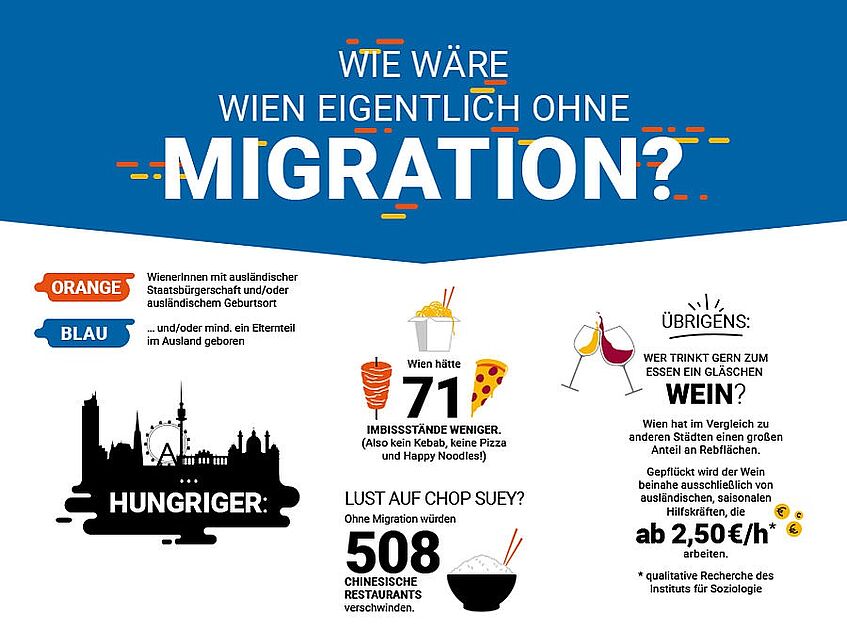
Migration
Continue to this infographics...